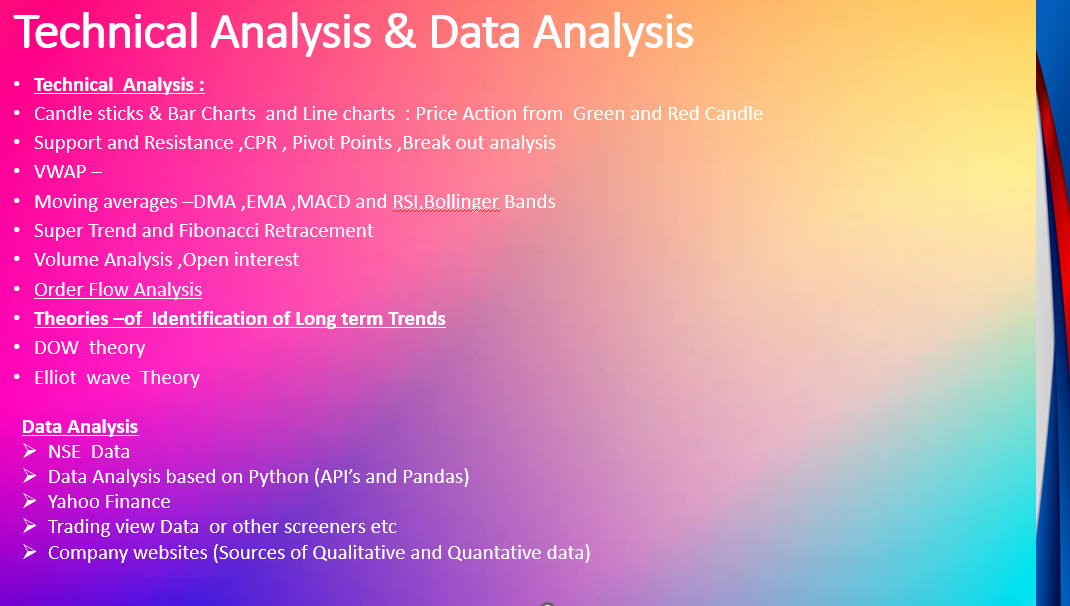
Technical analysis (TA) is a method used to evaluate and predict future price movements in the stock market by studying past market data, mainly price and volume. It relies on chart patterns, trends, support and resistance levels, and technical indicators like moving averages (SMA and EMA), Relative Strength Index (RSI), and Moving Average Convergence Divergence (MACD) to identify trading opportunities.
Pivot points and CPR (Central Pivot Range) offer key reference points for potential price reversals, while breakout analysis looks for price movements beyond these levels, signaling potential trends.
Traders use tools like Bollinger Bands to assess overbought or oversold conditions. Effective risk management, including setting stop-loss orders and determining position size, is crucial for minimizing losses. However, TA should be used with caution and in conjunction with fundamental analysis for better decision-making, as it’s not foolproof and relies heavily on market psychology and historical price action.
Financial Awareness on
Investments and Trading
Stock Markets
Copyright © 2025 Love Finance.